Scraping an Excel File in Python (pt. 1)
Python is one of the most versatile and in-demand languages out there. Follow me in this series as I take one real-life problem and build out three different solutions in Python.
In part 1, we will build a program to scrape a messy Excel file and turn it into relational data.
In part 2, we build and distribute reporting.
In part 3, we make a web interface using the Flask framework.
THE REQUEST
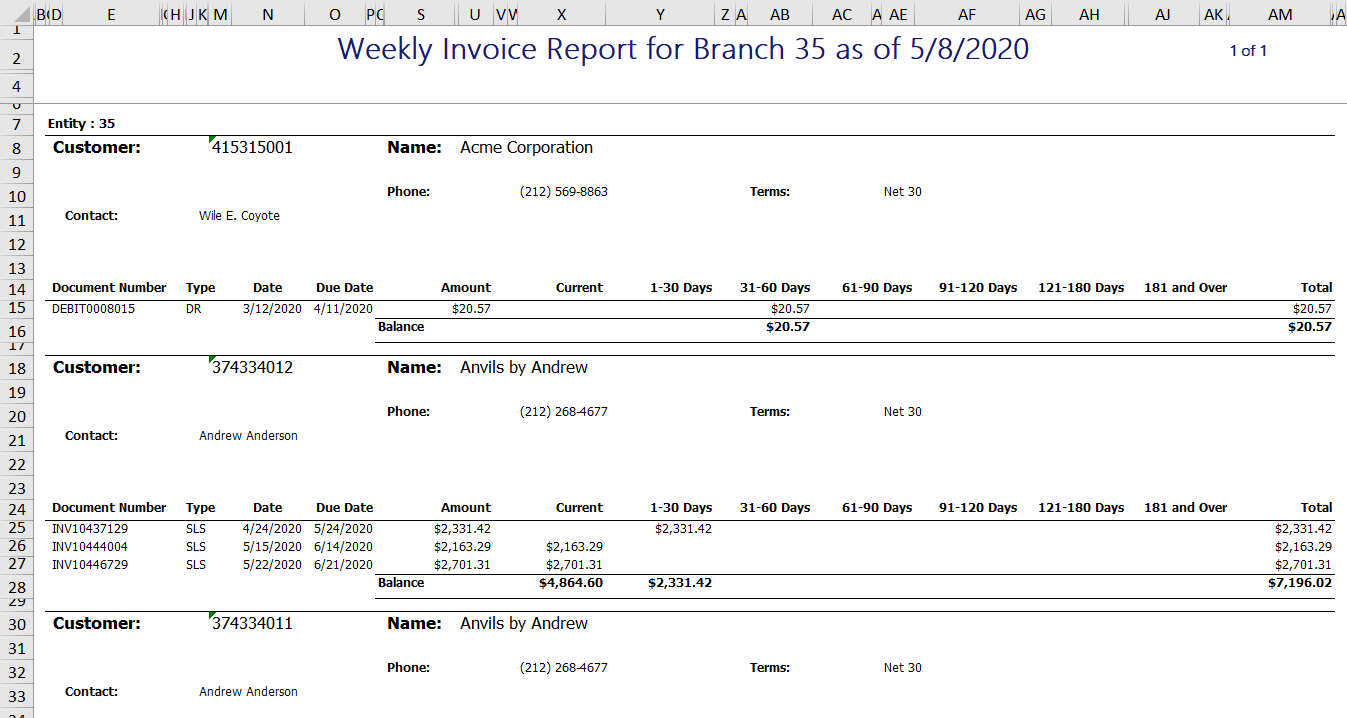
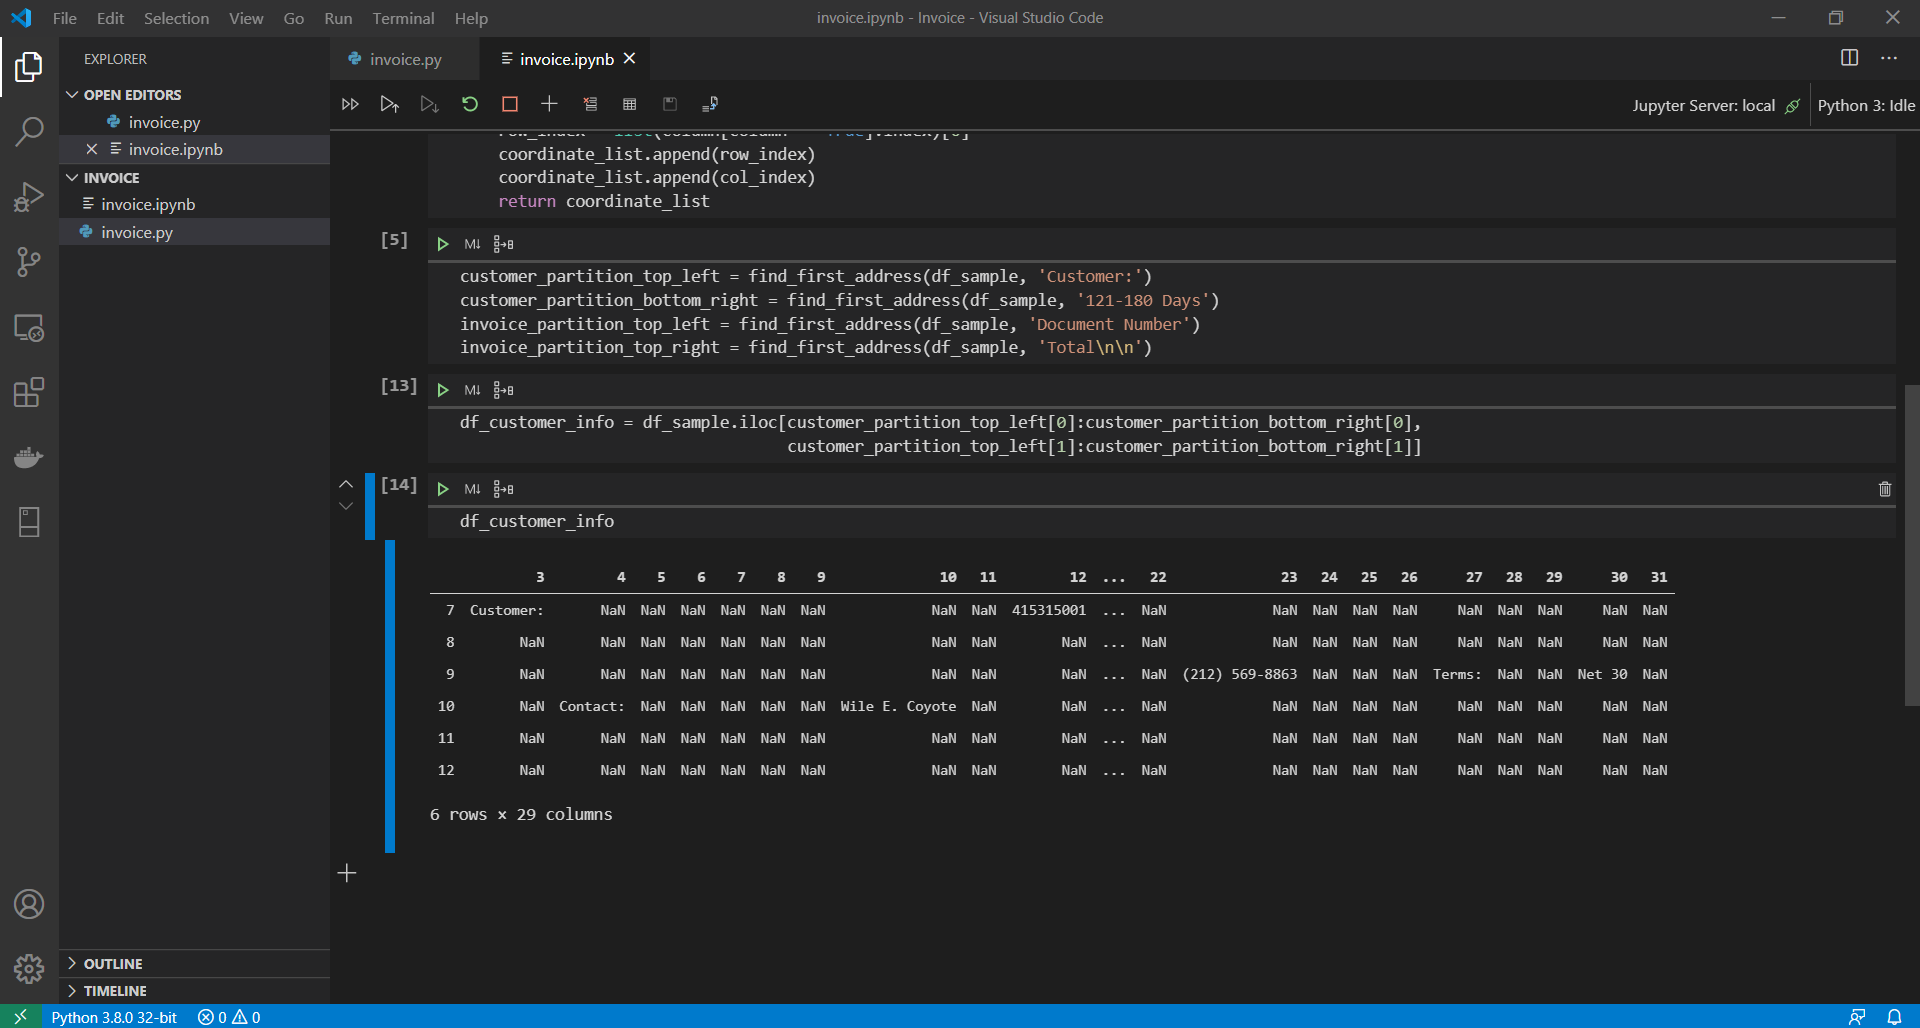
A mid-market company came to me recently and asked for help overhauling their invoice reporting system. Each branch of the company receives an Excel file every Monday. Let’s take a look here.
SOLUTION BRAINSTORMING
We need to figure out how to turn that file into something that’s useful for the client. The final product might ultimately take the form of a dashboard, or an email, or a website. But before we get to that, we need to put the data into good old-fashioned relational form, like this. The question is how we do it.
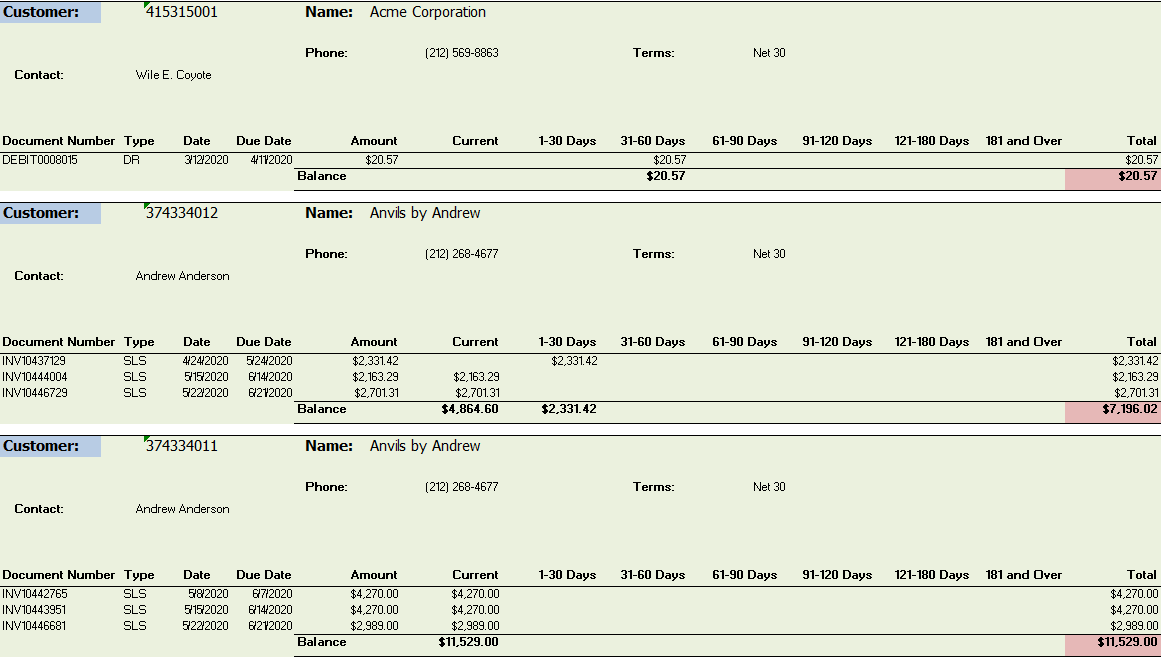
Let’s start breaking the input file up into parts. Each customer has its own section, marked with green. Each customer section starts with the same values, marked with blue and red.
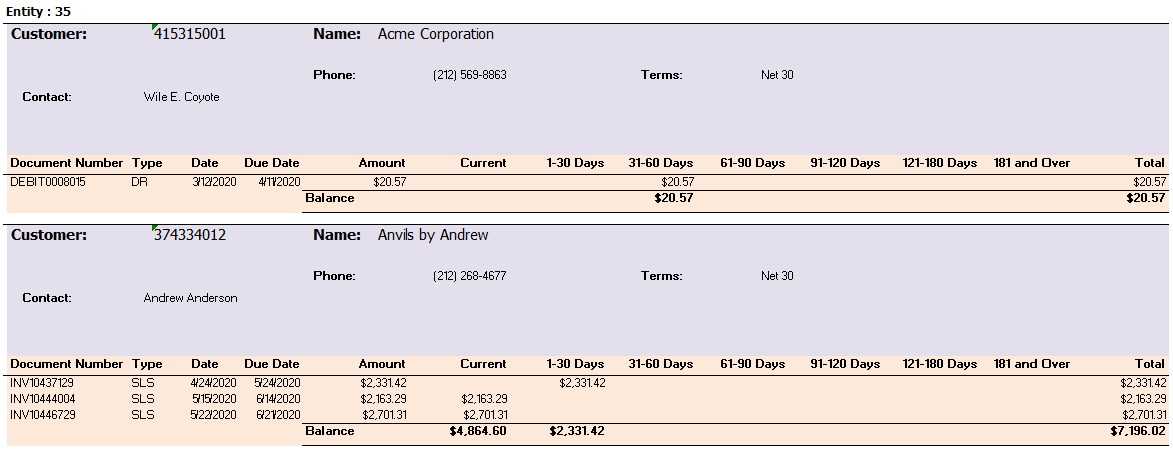
In the first four or five rows of every customer section, there is information about the company. Then below that, there is information about the invoices. Let’s will split each customer section into two separate sub-sections.
The top part will be called the CUSTOMER INFORMATION (purple) section, and the bottom part will be called the INVOICE INFORMATION (orange) section. Since the sections have different shapes, we are going to need to scrape both of them differently.
FIRST STEPS
Let’s import our input file using the Pandas module to read the Excel file and convert it to a DataFrame.
Try running the code you have so far. If you’re having trouble, make sure your filepath directory is valid. If there are spaces in any of the folder or file names, escape them with a double backslash, eg C:\Users\\My Folder\\Invoice\\File Name.xslx
Once your program executes without error, we can run a quick check to make sure that the read_excel process did what it was supposed to do:
Now that the Excel file is loaded into memory, let’s see if we can start making sense of the customer section concept we discussed earlier. First we will define a small subset of the original DataFrame using iloc.
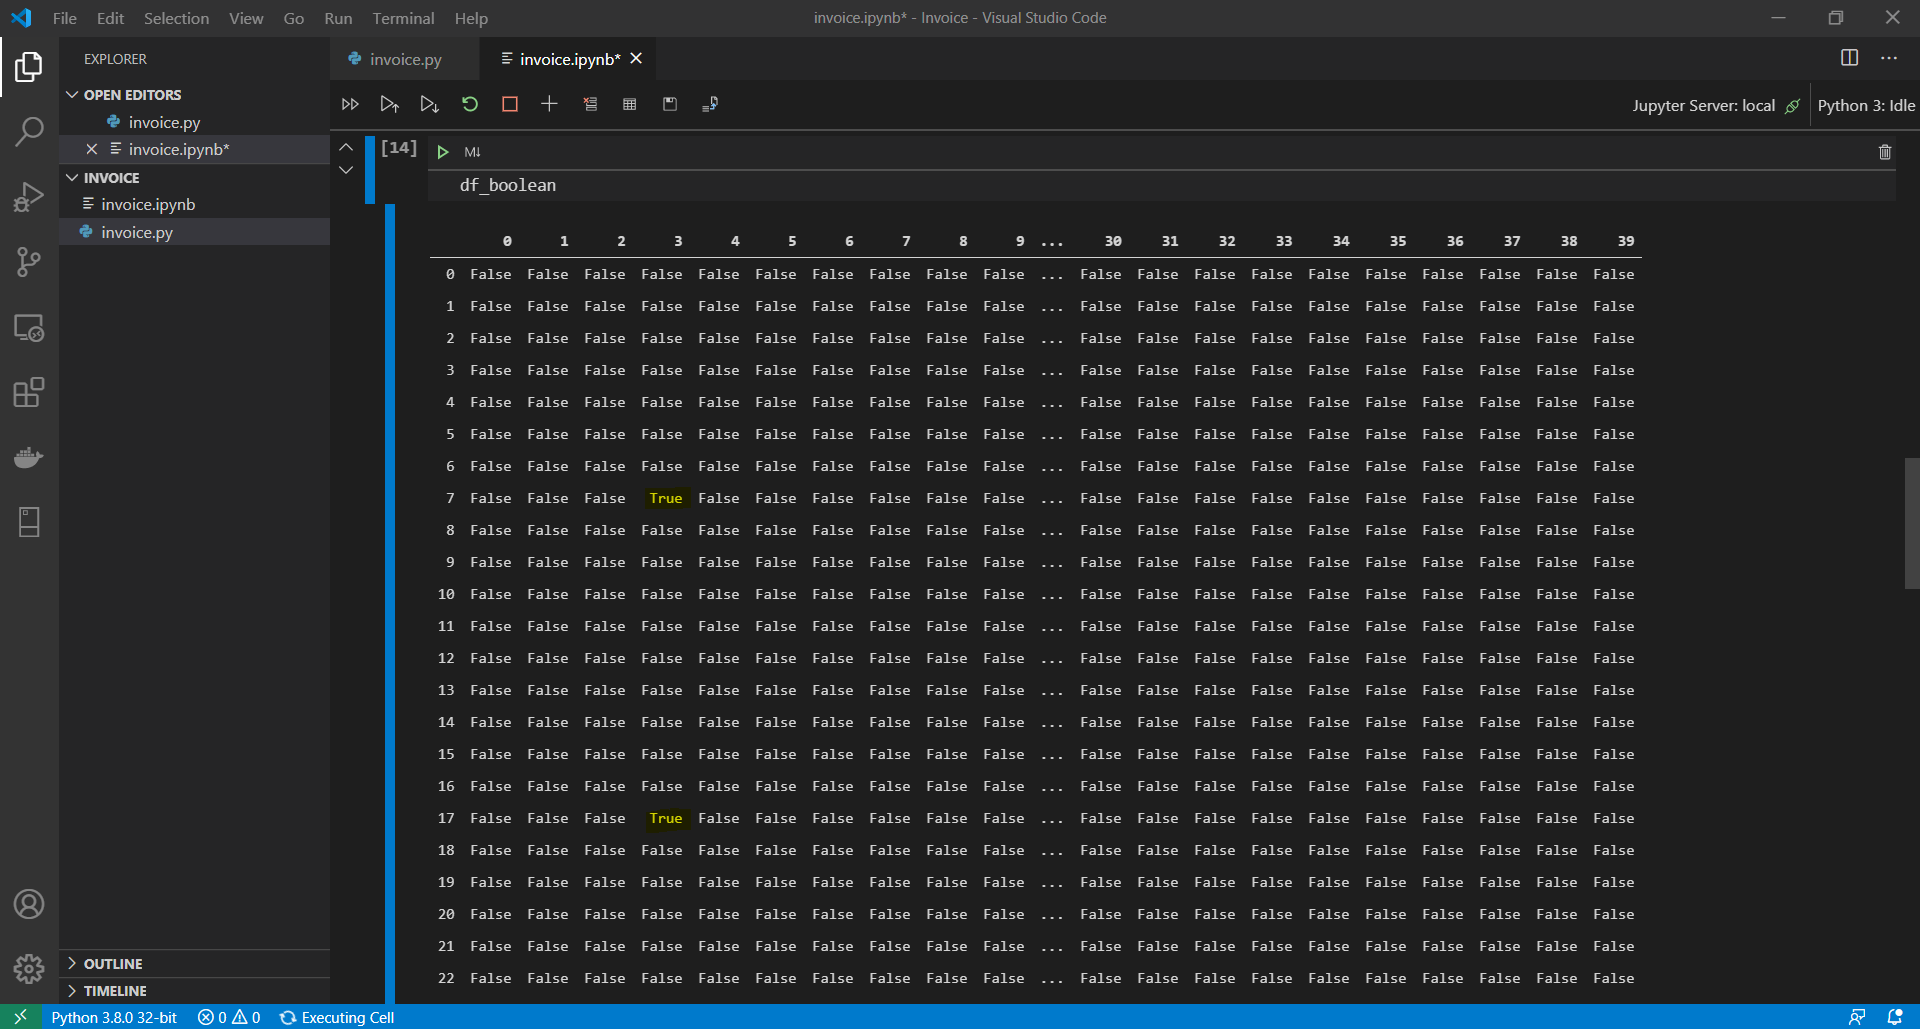
Now let’s filter the new DataFame using the isin and any methods.
Here’s what df_ boolbean looks like so far. Notices the True values at R7C3 and R17C3.
From there, all we have to do is apply the same slicing and indexing concept on the rows within column to return the row_index. Finally let’s append the row_index and col_index values to the empty coordinate_list variable.
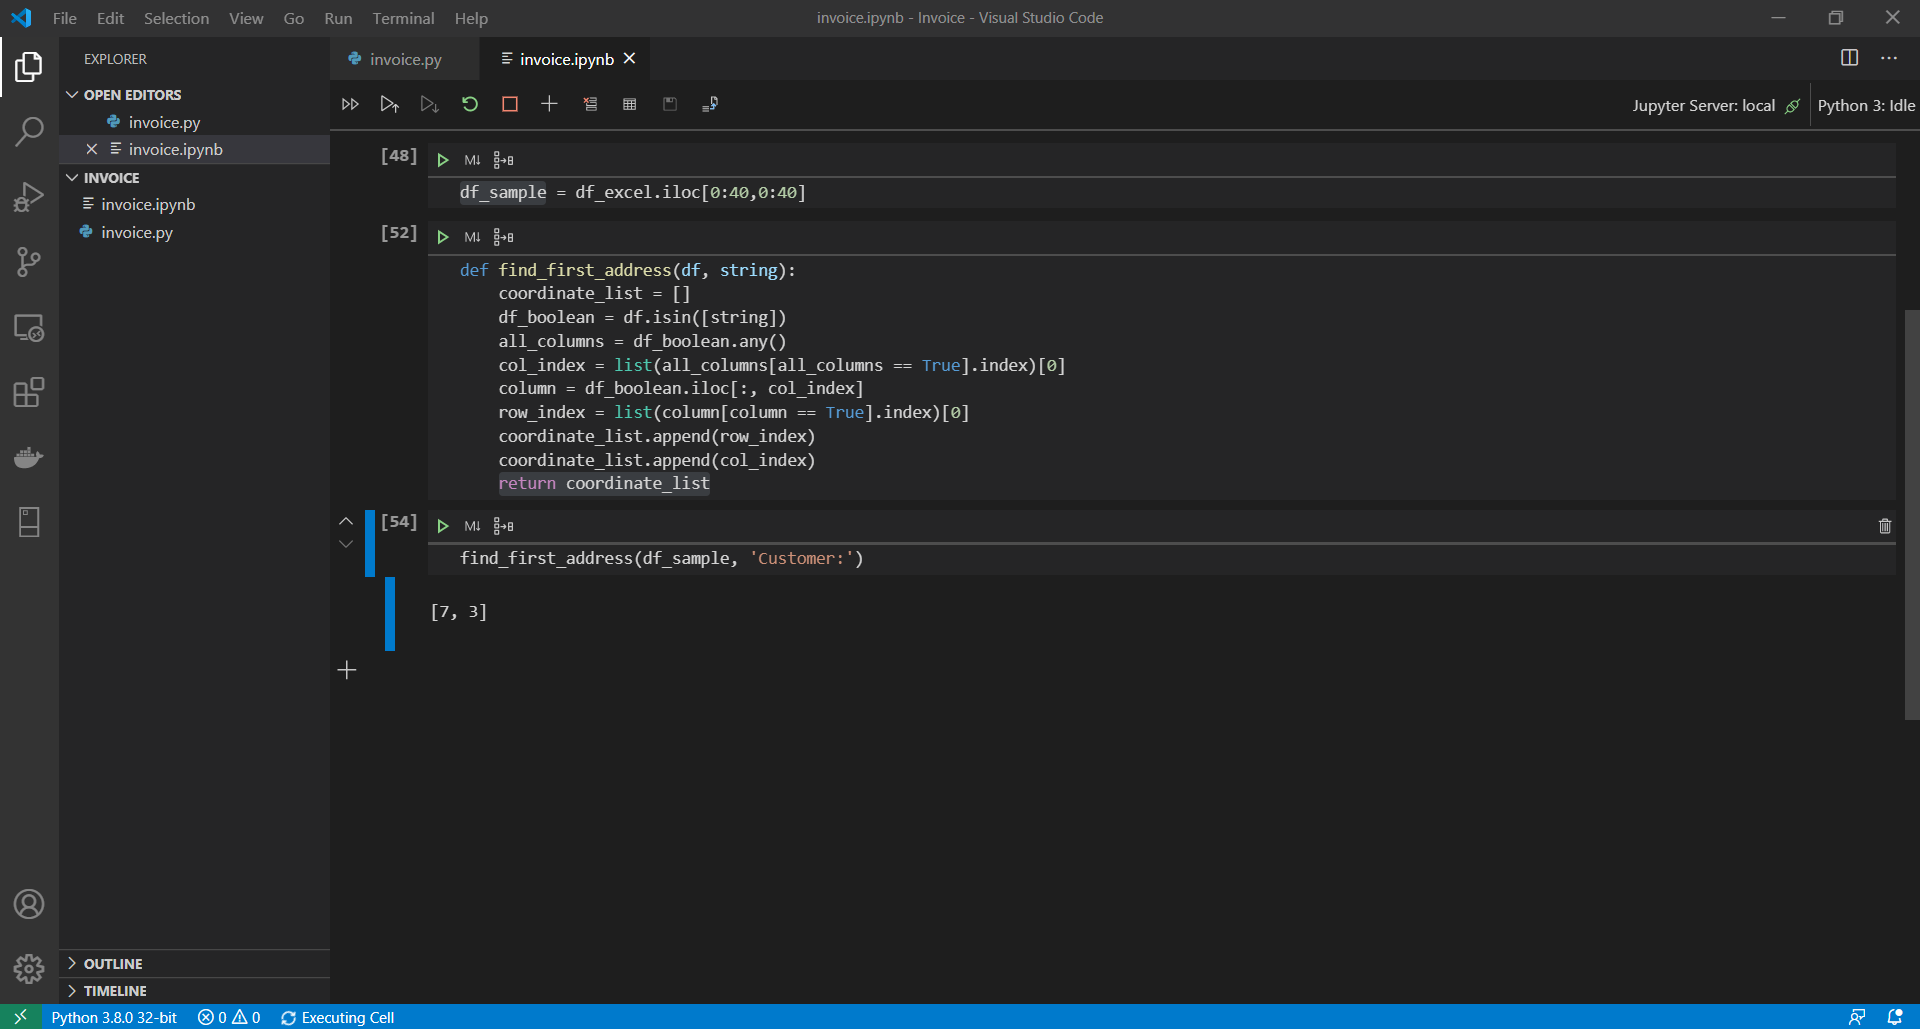
If we inspect the coordinate_list variable, it should contain the row and column index of the very first instance of the ‘Customer:’ string within our sample DataFrame. Putting it all together, we have:
Let’s make this procedure a bit more modular by turning it into a function. This will help us recycle the code quickly.
So now if we execute like this find_first_address(df_sample, 'Customer:') we should get back [7, 3].
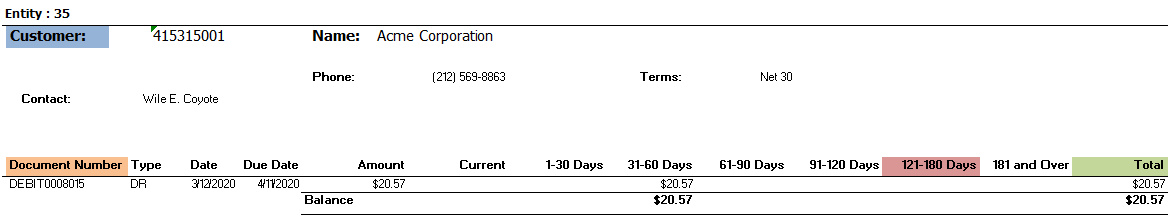
This gives the top-left anchor point of the very first customer section. Let’s calculate the rest of the anchor points:
Here we have calculated four boundary points here.
- The top-left point of the customer information section (blue)
- The bottom-right point of the customer information section (red)
- The top-left of the invoice information section (orange)
- The top-right of the invoice information section (green)
CUSTOMER INFORMATION SECTION
With the boundaries for our first section set, we are now able to define the customer information section as a new DataFrame.
df_customer_info is shown here.
Let's also create a new DataFrame called df_relational. This is where we can store all of the data we scrape out of each customer partition. Every time we move to a new customer partition, the data we want will go in here:
df_relational = pandas.DataFrame(index = None)
At this point, we have almost everything we need to begin looping through the file. The goal will be to start at the very first customer section (which we partially defined in the variable df_customer_info) and work our way down to the very bottom of the file. Let’s create a loop where the bulk of our processing will be done.
Since the program needs to iterate over each customer section, it seems the first step within the loop should be creating the next customer section as a DataFrame object. You’ll notice we have already done that in a previous step (refer to the variable df_customer_info). Let’s move that procedure inside the loop, since this is something that will have to be done every time the loop runs.
Here is the full program code so far.
Let’s take another look at df_customer_info. We need to start cleaning this up, which means getting rid of all of the NaN values.
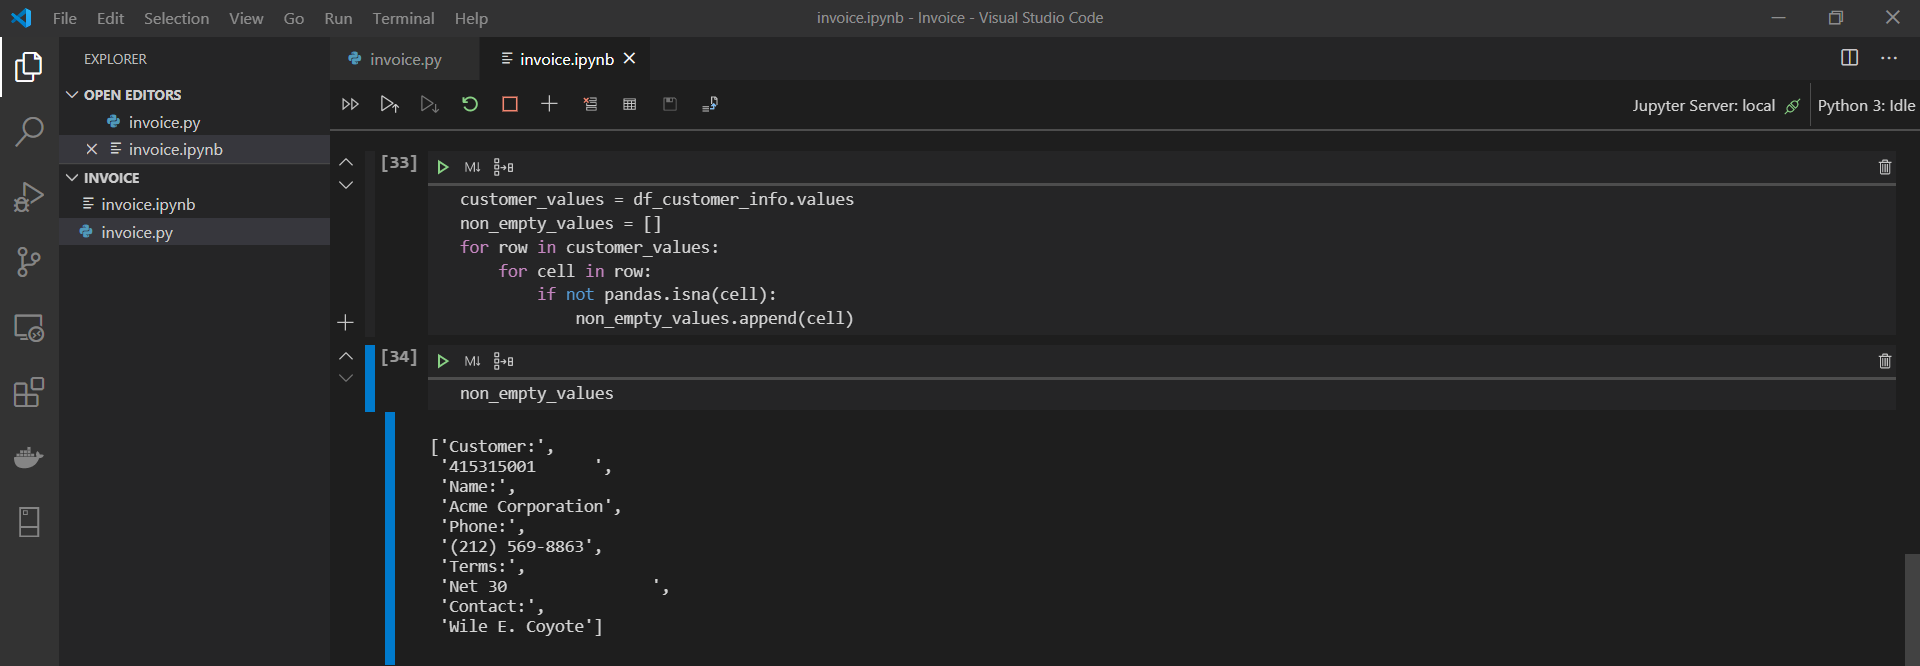
What would the DataFrame look like if we took all the non-empty values and put them into a single list? To find out, let’s convert the DataFrame to an iterable array, then cycle through it value by value to extract what we want.
Let’s take a look at the non_empty_values list.
Now we are getting somewhere! This actually looks like something we can use. The interesting thing about this list is that it follows a predictable pattern: Description, Value, Description, Value, etc.
In most programming languages, there is a way of storing data in key:value pairs. You can think of the key as a description or ID, and the value as the content of that key. Python stores key:value pairs in dictionary objects, and it just so happens that dictionaries are the perfect next step for our project.
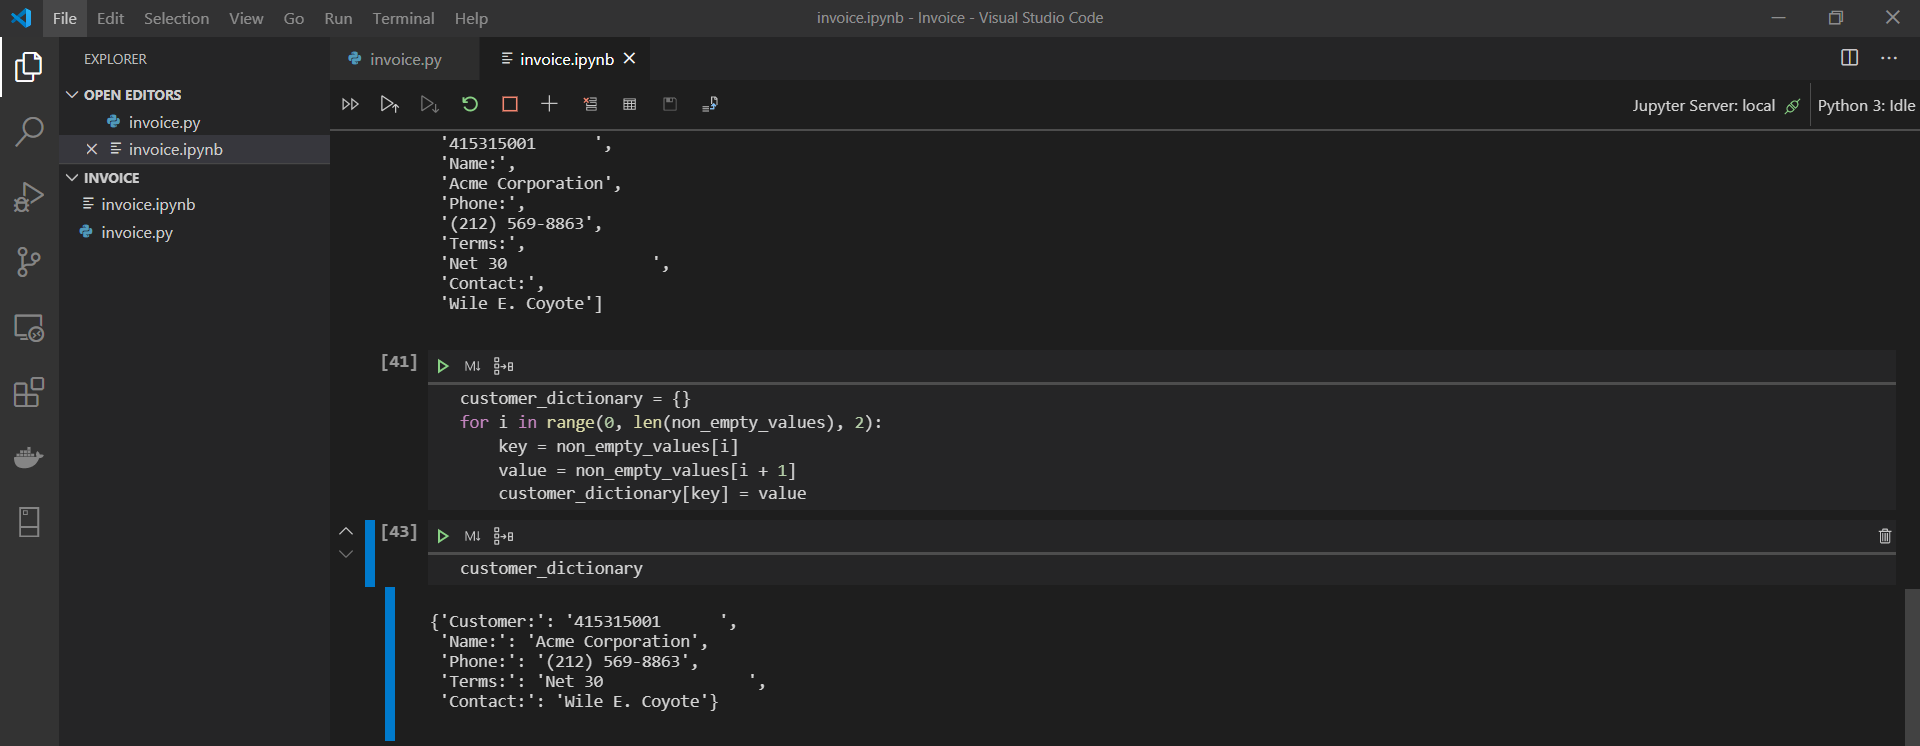
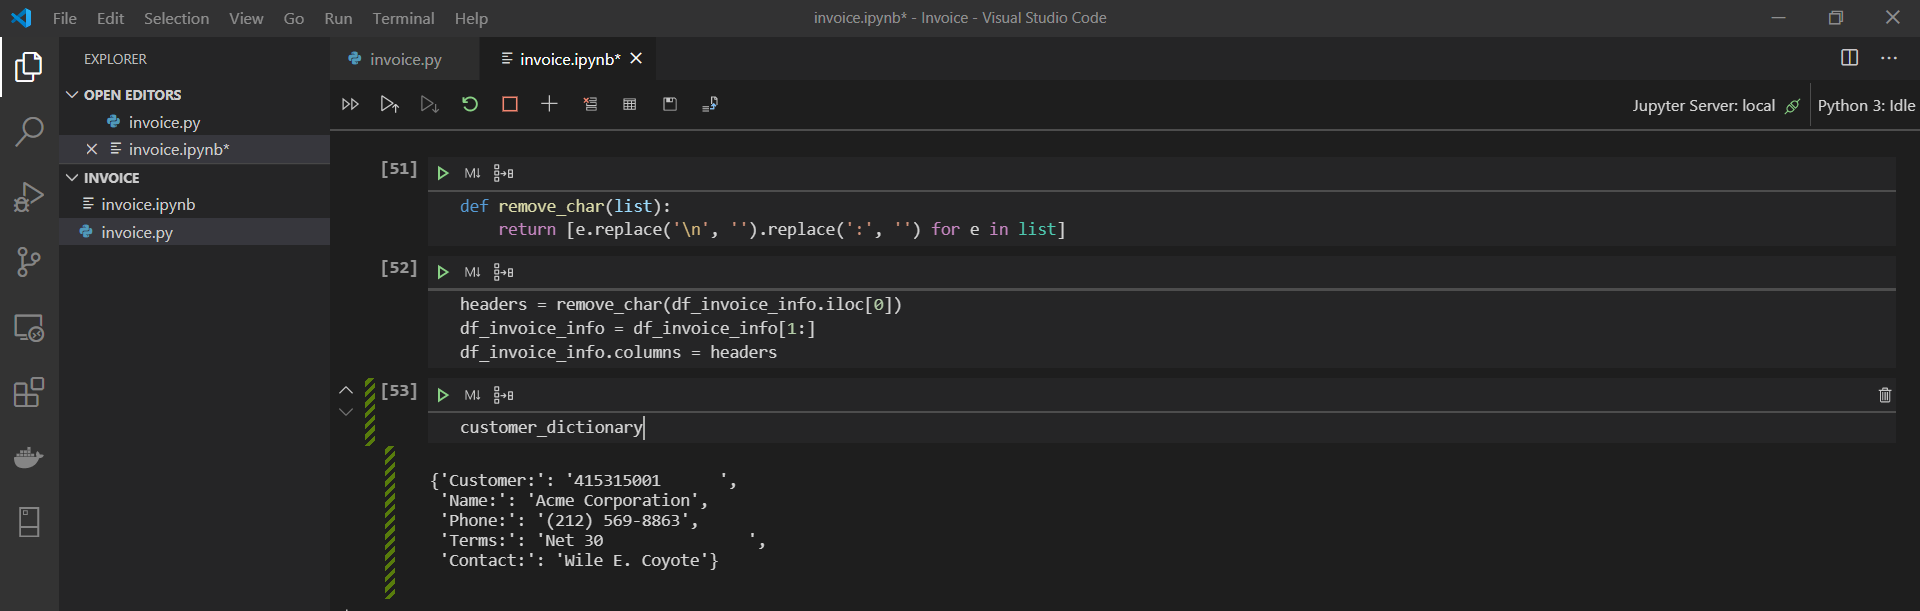
Let’s take a crack at transforming our non_empty_values list into a Python dictionary.
Here is what our new dictionary looks like.
Now that we have a structured data object which contains all of the customer information for this section, we can turn our attentions towards the invoice section of the section.
INVOICE INFORMATION SECTION
Unlike the customer information section, the invoice information section will not have fixed dimensions. Let’s look back at the input file to see why.
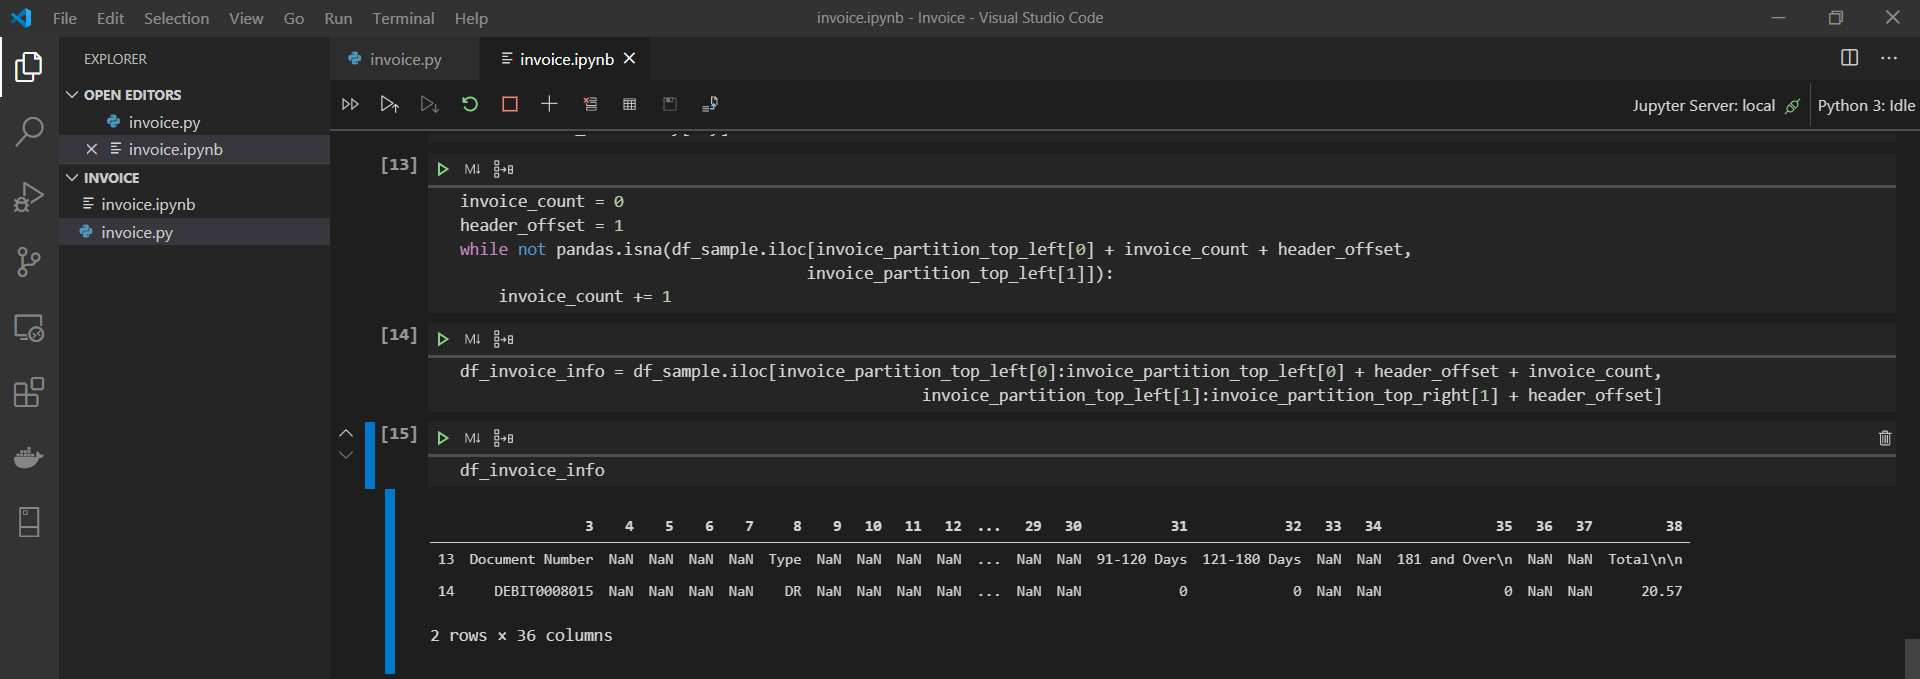
As you can see, Acme Corporation has one invoice but Anvils by Andrew has three invoices. Because of this, we cannot apply a fixed size to each invoice information section like we did with the customer information section. What we need to do instead is count the number of invoices for each customer. Let’s see how to do that.
Now that we have the number of invoices, let’s define our invoice information section as a DataFrame.
Let’s inspect our new DataFrame.
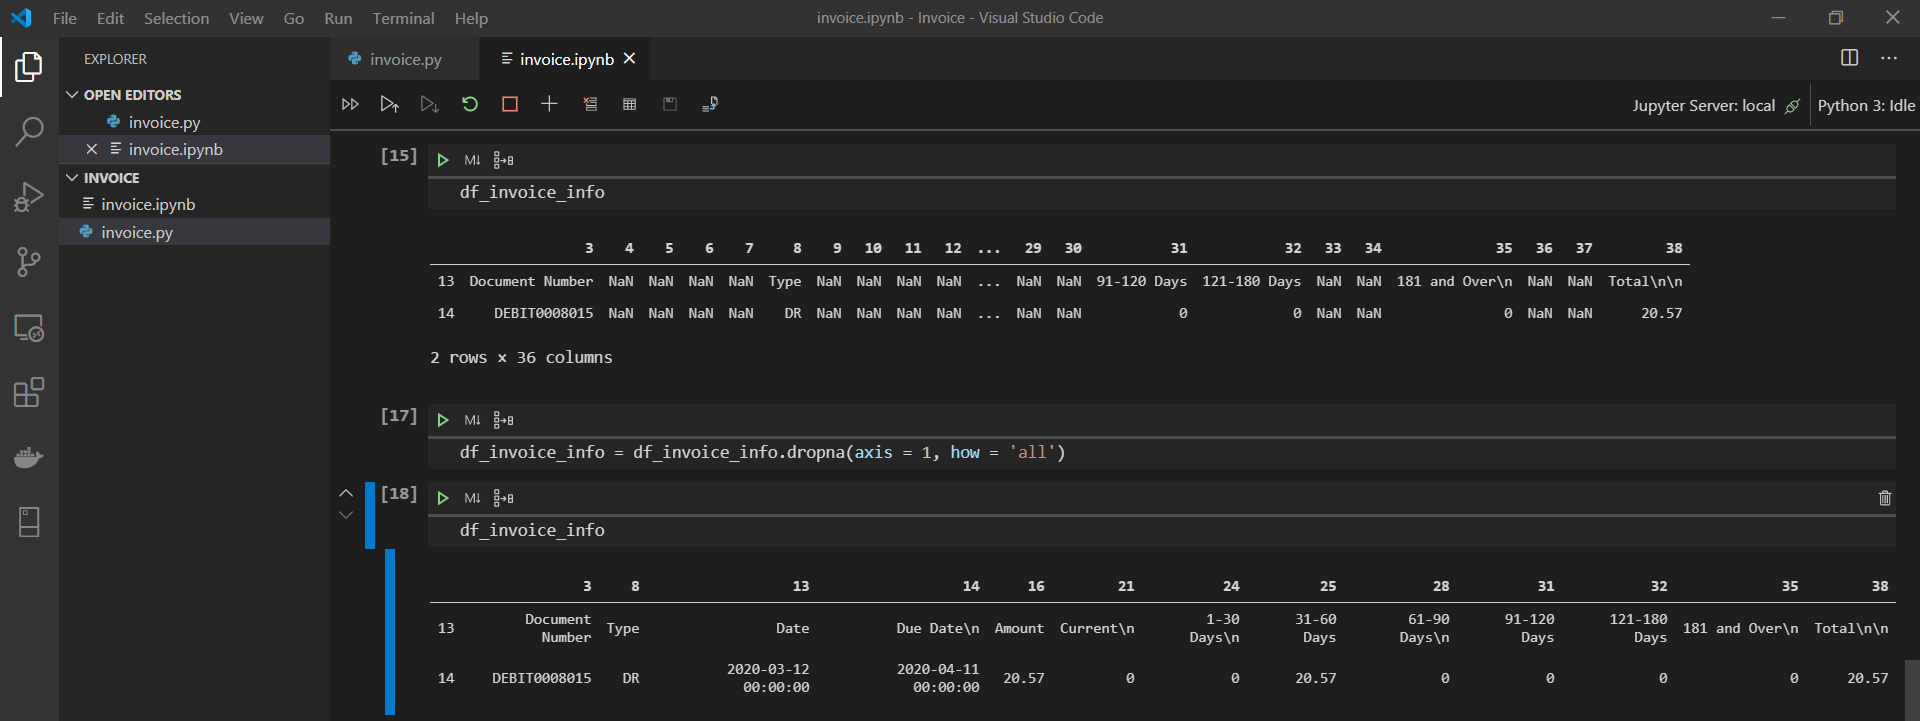
Plenty of NaNs just like we would expect, but at least the data is structured the way we want it. Let’s eliminate all columns where every value is an NaN.
df_invoice_info = df_invoice_info.dropna(axis = 1, how = 'all')
See df_invoice_info here. It now only has 13 columns instead of 39. Quite an improvement in terms of readability! One more thing, though — the current column names don’t tell us much. Really, the first row should be the headers, and the numbers at the top should be done away with.
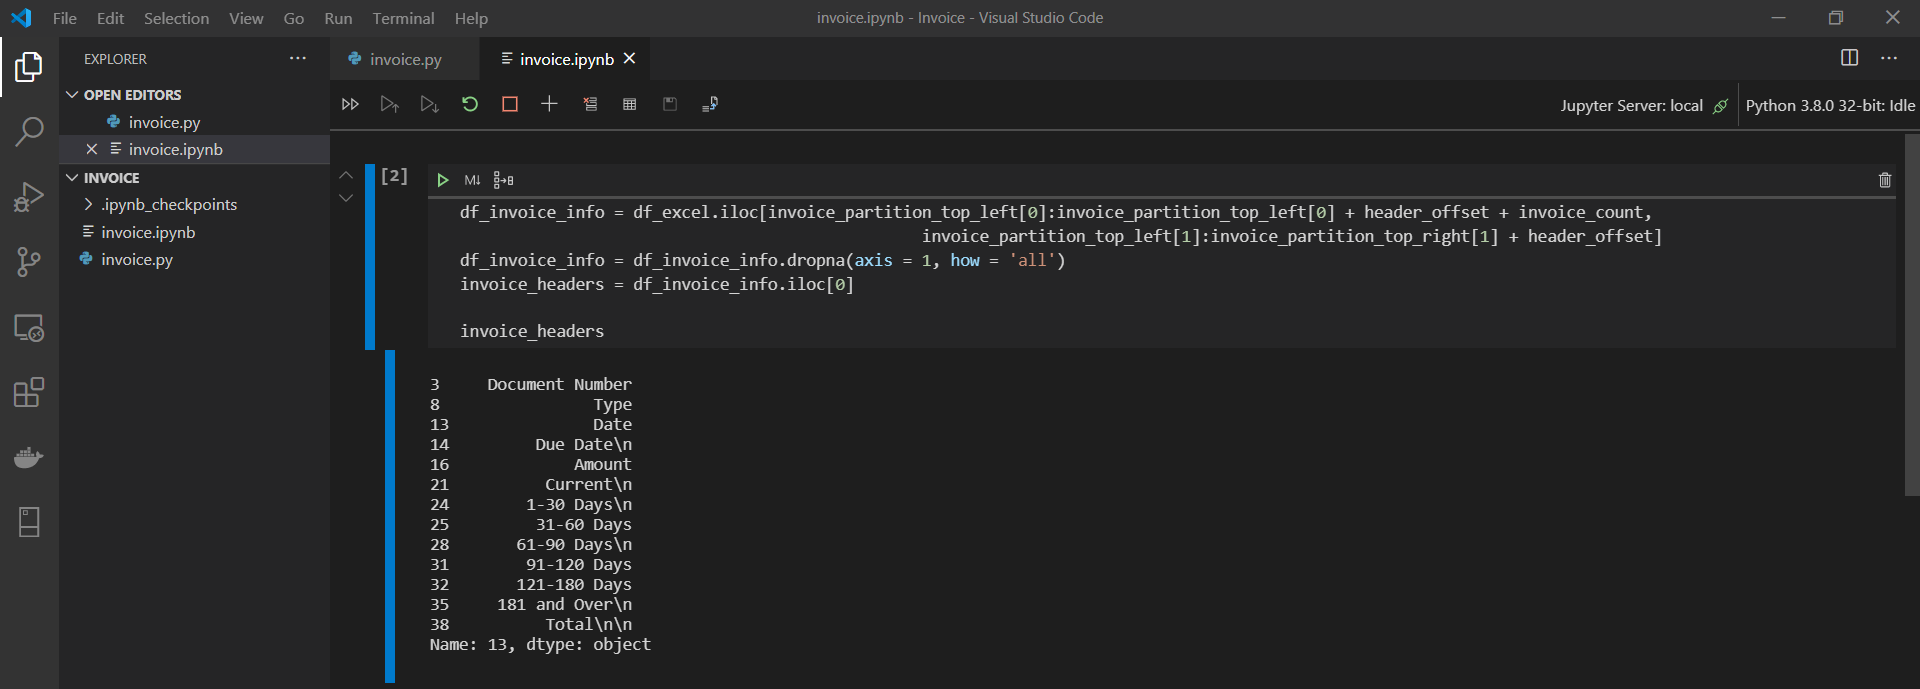
Let’s begin by creating a new variable called invoice_headers and setting it equal to the first row of our df_invoice_info DataFrame using iloc:
invoice_headers = df_invoice_info.iloc[0]
You can see from a printout of headers that a lot of the values end in \n, which is not helpful for us. Let’s also write a quick function to take those out. We will do this using list comprehension.
invoice_headers = [e.replace('\n', '') for e in invoice_headers]
Let’s put our new list comprehension procedure into a function so that it can be expanded upon and called whenever we want.
This new function should go outside the main loop, since we don’t want to redefine the same function every time the loop iterates. We already have another function definition in our file, so let’s put them together near the top of the file. The entire program so far should look like this:
If you try to run what we have so far, you’ll notice that it never actually finishes running. That’s because it’s caught in an infinite loop. We will come back to this before the end of this article, but before we get to that, let’s finish cleaning up our invoice data, starting at line 65.
Remember our customer information section? Let’s revisit that. When we left off, we had a dictionary with five key-value pairs. The keys will serve as the column names, and the values will server as the row level data. Let's look again.
MERGING CUSTOMER AND INVOICE INFORMATION
Currently, we have a dictionary with customer information (if you’re familiar with relational data, this is our dimension table), and we have a DataFrame with the invoice information (which is our fact table). In order to combine those two datasets, we need to convert them both to the same object type, then join on a common column.
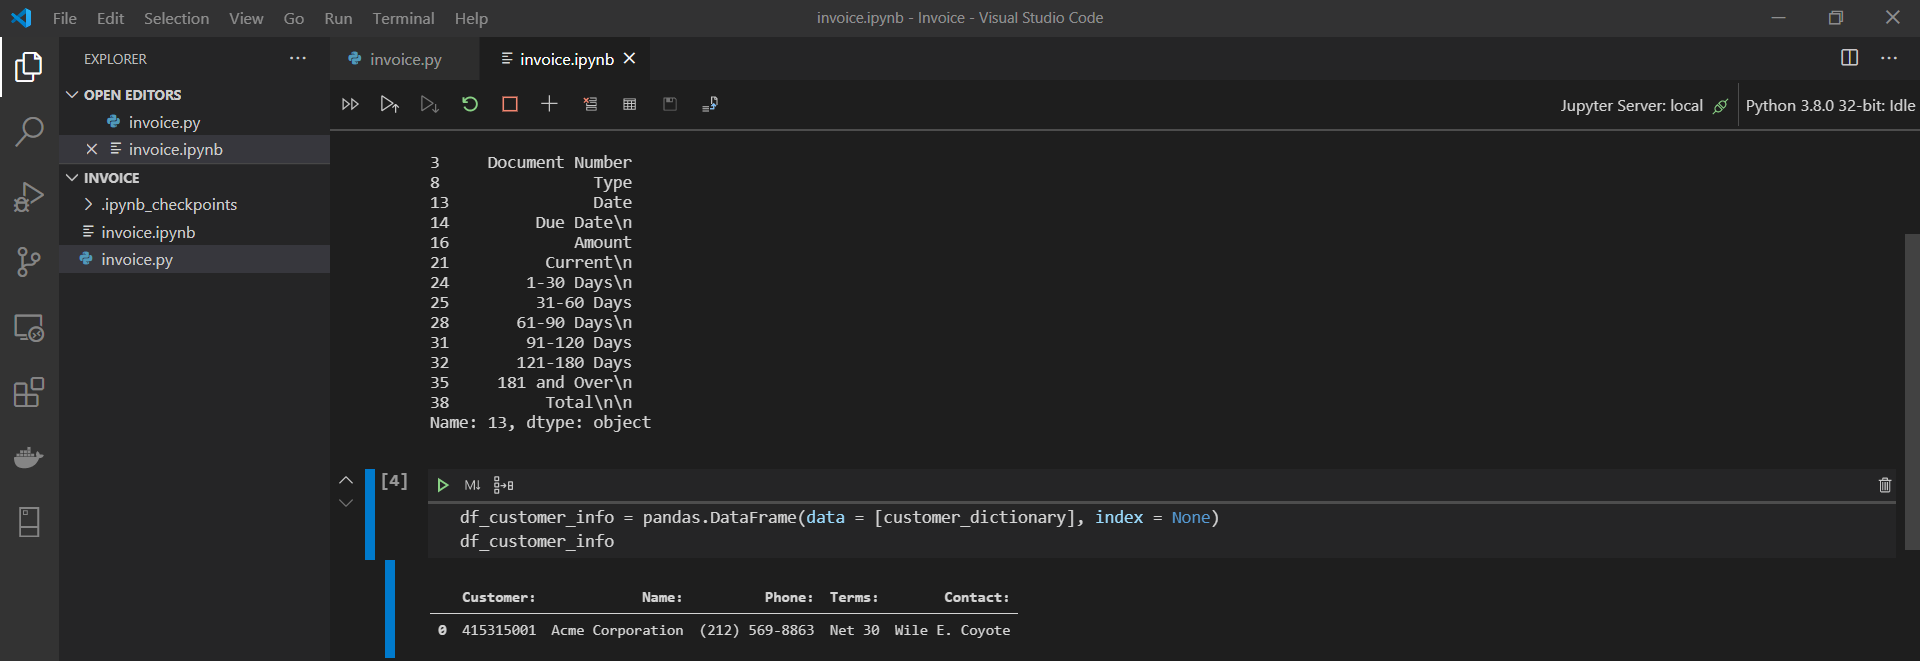
Start by converting customer_dictionary into a DataFrame and storing it in the existing variable df_customer_info. Pandas makes this easy. Let’s take a look:
The new df_customer_info variable looks great! But there is one nit-picky problem: the column headers all have colons in them. How can we address this? Well, we have already created a function that will loop through a variable and remove unwanted characters. First we make a slight modification to the function code. We need it to be on the hunt for colons now, not just line feeds.
Applying our remove_char function to the columns property of the new df_customer_info DataFrame:
Before we can add in our invoice data, our two datasets need to have a common column to join on. What we really want to do is make a Cartesian product between the customer data and the invoice data. To do this, let’s append a column to both datasets with zeroes all the way down. We will call this column key.
Now we are able to merge these two DataFrames together.
df_this_iter = df_customer_info.merge(df_invoice_info, how = 'outer')
Here’s a printout of df_this_iter.
We have successfully scraped our first customer! Now, let’s append this customer’s data to our rolling DataFrame, df_relational using pandas.concat:
All we have to do now is finish up our loop so that it will iterate until the end of the file. Let’s re-set our customer section boundaries the way we had done before:
And finally we need to recalculate the df_sample variable so that our loop can progress to the next customer section. Let’s put this before the boundaries are recalculated.
That does it! Here is the full program.
Stay tuned next month for improvements to this program, including report generation and distribution!
Wilson Becker
 Wilson Becker is one of Vaco's esteemed Business Intelligence consultants with experience delivering high-exposure analytics solutions. Wilson is highly skilled with 6+ years of experience in data engineering and task automation. Technologies include SQL, Python, SAS, VB, Tableau, PowerBI.
Wilson is passionate about studying the Bible and is a big classical music fan. His composer of choice is J.S. Bach.